
On Racial Bias in Driving Stops and the Veil of Darkness
On Racial Bias in Driving Stops and the Veil of Darkness
Although blacks are more likely to be stopped, this is due to racial differences in driving behavior.

When talking about systemic racism, one common argument is the notion of “driving while black.” This argument shows how, when compared to white drivers, blacks are more likely to be stopped and searched — despite whites having contraband at a higher rate than whites. Furthermore, black drivers are less likely to be stopped at night than in the morning, with this being dubbed the veil of darkness. In this post, I’ll argue that traffic stops by race are a result of differences in driving behavior and suspicion differences and that the veil of darkness argument doesn’t support the idea of racial bias.
Traffic Stops by Race
In general, there does seem to be a difference in car stops between blacks and whites when using the population benchmark. Although this is not an area of dispute, commentators are right to say that black drivers are more likely to be stopped than white drivers, but the reasons for this will be discussed in the following section.
Reviewing 5 months of data, the ACLU (2020) looked at D.C. police stops and searches by race. Black people made up 46.5% of the D.C. population but made up 72.0% of stops overall, 86.1% of stops that led to no warning or ticket, and 91.1% of searches that led to no warning or ticket. Although the ACLU does say that they really can’t say that this disparity is because of racism, they do say that it can be because of racism because (1) most black stops are unjustified; (2) blacks are more likely to be stopped in white areas and; (3) blacks are more likely to be searched than whites despite whites being found with contraband more.
Looking at California, Durali et al. (2020) found that despite being 6.3% of the population according to ACS data, 13.4% of blacks were stopped by police. According to their findings, “a higher percentage of Black individuals were stopped for reasonable suspicion than any other racial identity group”:
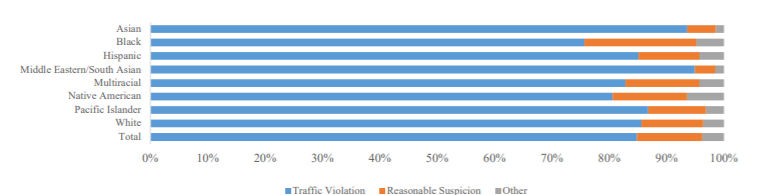
Furthermore, blacks were searched more often despite whites yielding contraband at a higher rate than blacks. Blacks were also more likely to be stopped and arrested in the morning than at night, something called the “veil of darkness” (henceforth, VOD) — when one’s race is masked at night. According to the VOD logic, this supports the hypothesis of racial bias since black drivers are less likely to be stopped at night when one’s race is harder to make out.
Furthermore, blacks were searched more often despite whites yielding contraband at a higher rate than blacks. Blacks were also more likely to be stopped and arrested in the morning than at night, something called the “veil of darkness” (henceforth, VOD) — when one’s race is masked at night. According to the VOD logic, this supports the hypothesis of racial bias since black drivers are less likely to be stopped at night when one’s race is harder to make out.
Looking at the San Diego Police Department, Berjarano (2001) remarked that blacks only make up 8% of the San Diego population but 12% of all those stopped, and 14% of those stopped for equipment violations. Similarly, Zingraff et al. (2008) found that although blacks make up only 19.6% of licensed drivers in North Carolina, 22.9% of traffic tickets were issued to blacks. In Florida, blacks made up 22% of all seat belt citations but only 13.5% of Florida’s drivers (ACLU 2016). These citation differences could not be explained by seat belt compliance since the difference in seat belt compliance between blacks and whites was not large enough, to begin with (91.5% v. 85.8%). Similar results have been found in Maryland and Illinois (Harris 1999; ACLU 2014), with whites being more likely to be found with contraband in Maryland. One of the more popular studies comes from Lamberth (2010) in New Jersey. Despite blacks making up only 13.5% of drivers on the road, they made up 42% of those stopped by police.
Going back to the VOD, Pierson et al. (2020) looked at over 100 million traffic stops and found that blacks and Hispanics were more likely to be stopped at higher rates than whites, more likely to be searched despite whites having more contraband, and blacks were less likely to be stopped at night than in the morning. This study, though, did not use a population benchmark and instead used the threshold test (Simoiu, Corbett-Davies, and Goel 2017). This test uses the rate at which searches occur and their success rate (i.e. they find contraband), with them finding that the bar to search non-whites is lower.
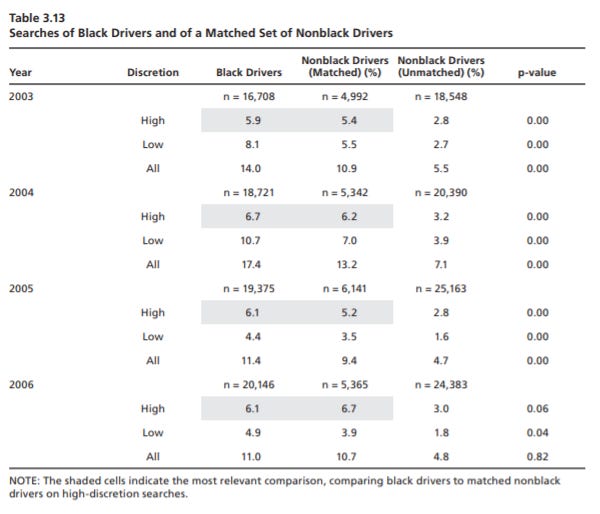
Looking at hit rates through national data, Persico and Todd (2006) looked at hit rates by race from 15 studies and found the average white-black hit rate at 2.4. (Table borrowed from Last 2019.)

Based on all this evidence, some would conclude that this disparity is due to racial bias in the criminal justice system. Indeed, this has been the position taken in some of the studies cited above, and in the media with them calling blacks being stopped and searched more than whites “driving while black” (e.g. LaFraniere and Lehren 2015; Brown 2019; Lartey 2018; Gold 2016). In the next section, I’ll argue that these disparities are a result of racial differences in driving behavior rather than racism.
Race Differences in Driving Behavior
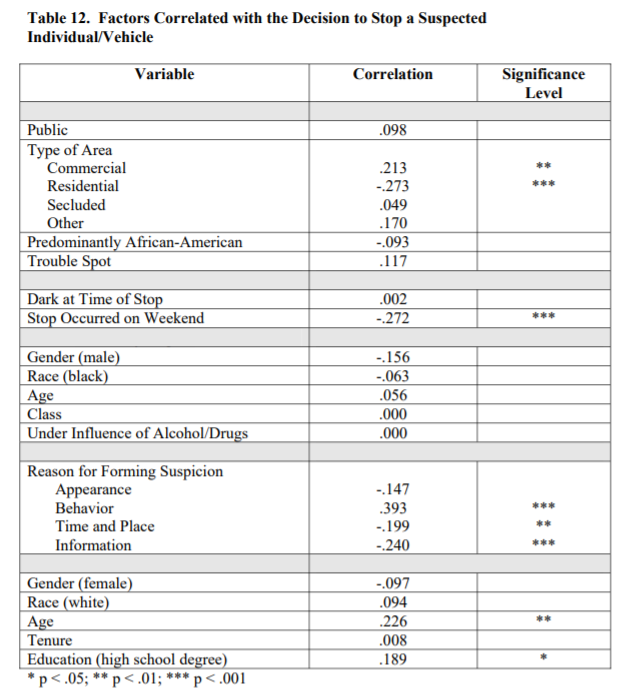
First and foremost, the effects of race prior to being stopped are weak and statistically insignificant. As was found in Geoffrey et al. (2012), the effects of race prior to being stopped were -0.063 and not statistically significant. Thus, simply being black has almost no effect on being stopped.
Since race seems to have no effect on being stopped while driving, it’s hard to think that police are racially biased in who they stop. The null hypothesis should not be that race is the reason, but rather racial differences in how blacks and whites drive.
When asked why they were stopped by police when driving, blacks tend to report committing more driving violations are a higher rate than whites. Besides speeding, where there are larger racial differences, blacks tend to have higher vehicle defects, record checks, illegal turn or Lange changes, other, and no reason given (Ingraham 2014).

Other reasons either show whites to be slightly higher or almost no racial differences. The differences for “no reason given” could be biased due to the fact that when someone is stopped by an officer of a different race, they think that the stop was not legitimate when compared to when stopped by an officer of the same race (Langton and Durose 2013).
Going back to Geoffrey et al., being suspicious was correlated with the chances of being stopped by an officer. The reasons for suspicions were coded into (1) appearance, (2) behavior, (3) time and place, and (4) information. According to the researchers,
“Appearance” refers to the appearance of an individual and/or vehicle, and can refer to things such as distinctive dress, indicators of class, vehicle type, color, condition, and the like. “Behavior” refers to any overt action taken by an individual or vehicle that seemed inappropriate, illegal, or bizarre. “Time and place” refers to an officer’s knowledge of a particular location (e.g., park, warehouse district) and what activities should or should not be expected thereafter a particular time (e.g., after hours). Finally, “Information” refers to information provided by either a dispatcher or fellow officer (e.g., BOLO)
Blacks had a higher rate of suspicion formed than whites but were a lower % of stops made when compared to whites.

Thus, it does not seem race is responsible for blacks being stopped at a higher rate when driving than compared to whites. However, a response to this may be that racial bias does play a role since blacks are less likely to be stopped at night than in the morning. The most widely cited study on this issue, as already noted above, is Pierson et al. As can be seen from their table below, blacks are less likely to be stopped at night than in the morning. However, there are significant limitations
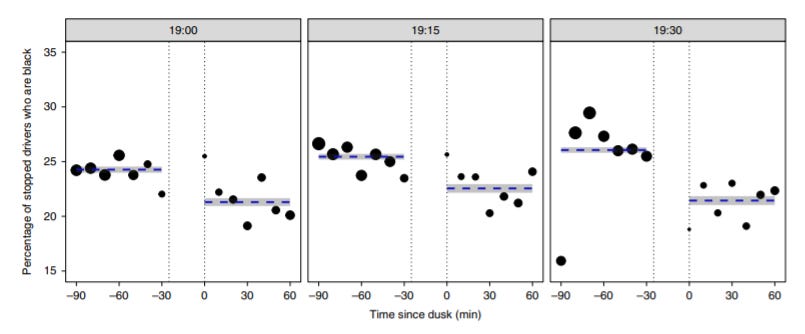
The first limitation is the lack of effect size given. An effect size would allow us to see how big the difference between blacks stopped at night and in the morning is, to begin with, but instead, we only have percentages to go off of. This could lead to overestimates of the size of the difference since a percentage could lead to either a small, medium, or large difference. The second limitation is their lack of adjustment for driving violations. This is important since if races do differ in driving behavior, then not controlling for driving violations can lead to misleading results under the VOD model.
Stelter et al. (2022) reported that:
In addition, we removed stops during the ambiguous twilight period of approximately 30 min between sunset and dusk. Note that these restrictions considerably reduced the number of police stops included in our analyses to 9,506,820 stops during daylight and 9,140,738 stops during darkness, measured in 1,022 counties in 15 states. Our analyses demonstrate that proportions of stopped Black drivers in comparison with the Black county population were lower during daylight (M = 2.23, SD = 5.21) than during darkness (M = 2.44, SD = 4.56), t(1009) = −5.21, p < .001, dz = −0.16, 95% CI = [−0.23, −0.10]. Thus, in contrast with the analyses by Pierson et al. (2020), ours did not reveal greater disparities at daylight (during which drivers’ race is presumed to be more visible).
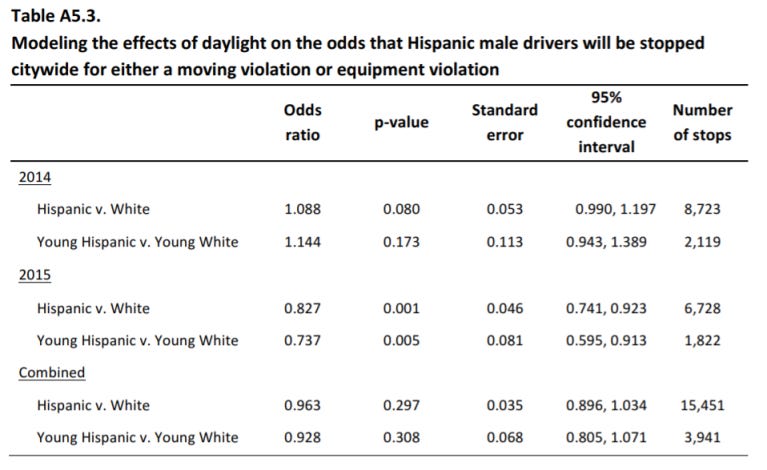
Looking at San Diego, Chanin et al. (2016) found that once driving violations were adjusted for, the black-white difference in stops under a daylight model was statistically insignificant and the OR was almost at 1.00, showing no racial differences in being stopped in the morning and at night.
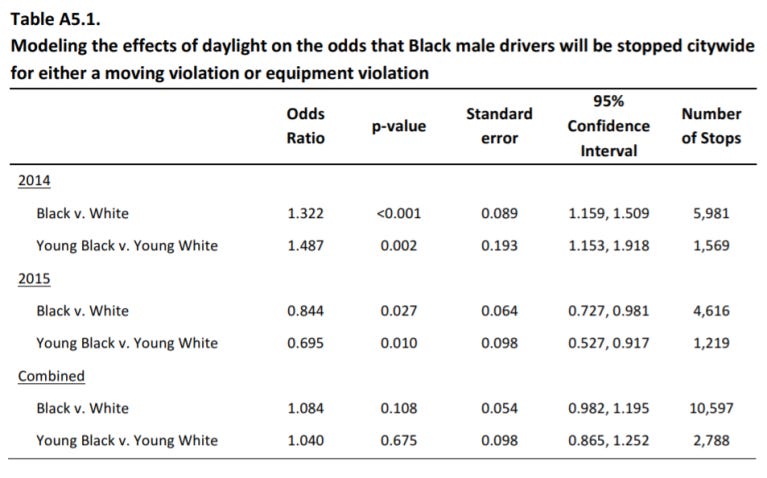
The same was even true for Hispanic-white differences.
Schell et al. (2017) looked at stop differences, stop length, search rates, hits, and stops through daylight differences in Cincinnati. After adjusting for time, the context of stop, and place, there was no racial bias in driving stops in the daylight and dark.

After adjusting for the prior variables, there was no racial bias in stop duration and even searches.

The same was also found for hit races once confounders are adjusted for.
Dunham et al. (2005) also found the officer’s race to not be associated with frisking, using force, searching a suspect, issuing a warning, or arresting a suspect. However, it was associated with issuing a ticket, with white officers being more likely to issue tickets than black officers.
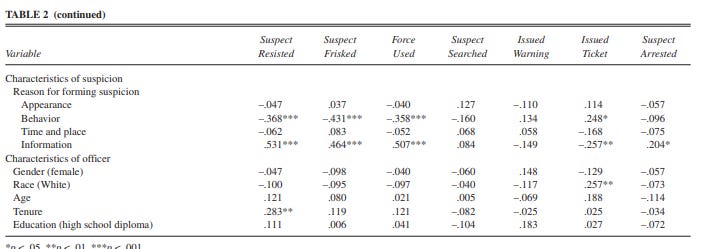
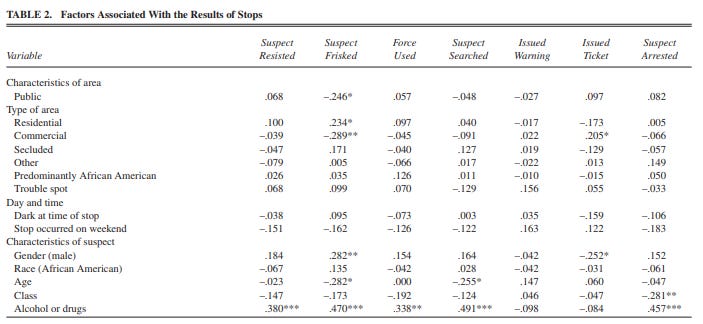
Furthermore, race was not significantly associated with having been frisked, having forced use on them, being searched, being issued a warning, being issued a ticket, or being arrested. Blacks were more likely to be frisked, with the effect being somewhat practically significant, but not statistically significant. However, this could reflect suspicious behavior rather than racism.
Even in England, there seem to be no consistent differences in the racial proportions of those stopped in the morning and at night. While not adjusting for moving violations, there seems to be no consistency overall (Waddington et al. 2004).

In conclusion, there seems to be no evidence of racial bias in traffic stops overall and especially under the veil of darkness model. Race seems to have no effect overall, and adjusting for confounders makes the race gaps go away. This is inconsistent with the idea that “driving while black” is due to racism.
Not convincing. The inherent limitations and flaws in this Schell’s measurements makes the results inconclusive: “In approximately one-quarter of the recordings, either the video or the audio was of poor quality (e.g., camera was not aimed so that driver and officer were in the field of view, or the audio quality would not allow coders to understand the driver). The number of cases in which the video record was not complete (omitting either the beginning or end of an incident) dropped to 3 percent…The fact that an effect is not significant within every year’s data should not be interpreted as a change in police or driver behavior across years but as an inherent limitation of working with a random sample of 300 incidents. Analyses of the communication variables have somewhat less power, due to the incomplete data caused by inaudible audio…The actual content and quality of the recordings presented real limitations on what measures could be reliably extracted from these interactions. Specifically, the single camera position (almost always 30–50 feet behind the stopped driver); low video resolution; single, lapel-style microphone on the officer; and high ambient noise limited the measurements that could be taken from analysis of the recordings.”